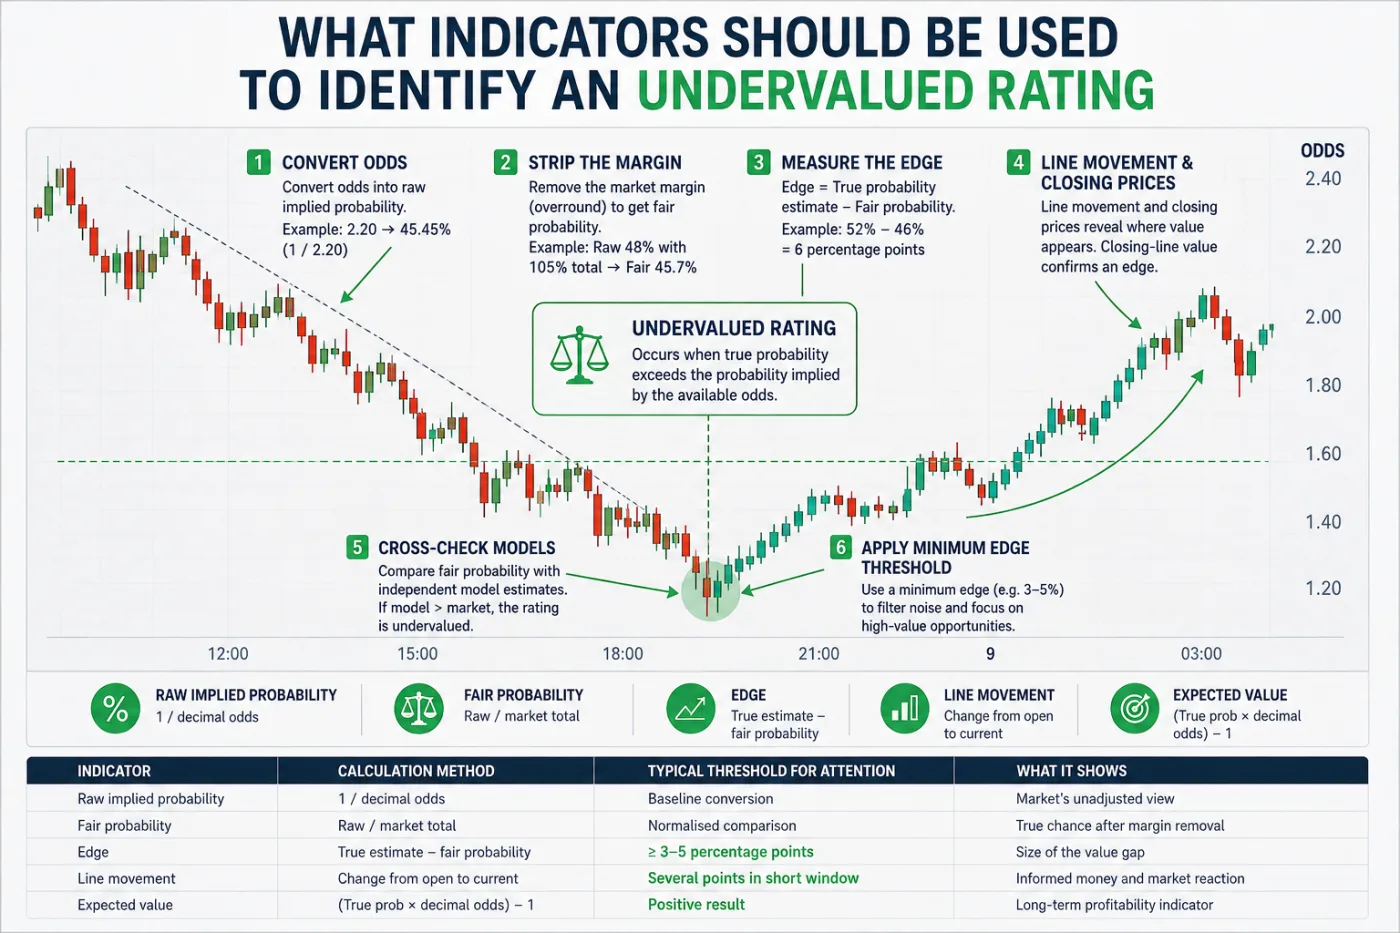
Market margins in three-way outcomes commonly range between 4 and 7 percent. If the sum of raw implied probabilities hits 105 percent, the embedded margin equals 5 percent. An undervalued rating appears when the true probability of an outcome exceeds the probability implied by the available odds, a distinction that can be maintained when reviewing data related to 1xbet registration; bettors quantify this gap through several measurable indicators. The process starts with conversion of odds and proceeds to comparison against independent estimates.
Consistent application of these checks isolates ratings that carry positive expected value. Comparing the same market across multiple sources can reveal whether an apparent gap reflects genuine mispricing or differences in margin. Repeating the calculation over time also helps separate temporary fluctuations from persistent valuation differences.
Convert odds into raw implied probability
Decimal odds invert directly into probability. If the price stands at 2.20, the raw implied probability equals 45.45 percent. American odds require separate formulas for positive and negative figures, while references such as bonus 1xbet may appear alongside market information without changing the underlying probability calculation. This raw number still contains the market margin and therefore overstates the true chance. Removing the margin produces a fairer estimate of the probability assigned to each outcome. Comparing the adjusted figure with an independent probability estimate helps identify meaningful differences in valuation.
Strip the margin to reach a fair probability
Summing all raw implied probabilities in the market produces the overround. Dividing each raw figure by that total normalises the values to 100 percent. If one side shows 48 percent raw against a 105 percent total, the fair probability drops to approximately 45.7 percent. Fair probabilities enable direct comparison across different sources.
Measure the edge against a personal or model estimate
Subtract the fair market probability from the estimated true probability. If the estimate reaches 52 percent while the fair market probability sits at 46 percent, the edge equals 6 percentage points. Positive edges of 3 to 5 points or higher typically warrant closer scrutiny. Expected value follows from multiplying the edge by the potential return.
How line movement and closing prices signal undervalued ratings
Line movement reveals where informed money enters the market. If odds lengthen on a side after early action, the later price may contain more value than the opening number. Closing-line value tracks whether a taken price beats the final market consensus. Bettors who consistently capture closing-line value demonstrate an ability to identify undervalued ratings before the market corrects. Volume shifts toward longer odds often accompany these discrepancies.
Comparison of opening, mid-market and closing figures supplies a time-based indicator of relative undervaluation. Markets that move several points in a short window frequently expose temporary mispricings. Systematic logging of these movements sharpens detection of ratings that lag behind available information.
Cross-check against independent statistical outputs
Models that process form, matchup data and situational factors generate independent probability estimates. If the model probability exceeds the fair market figure by a clear margin, the rating qualifies as undervalued. Hybrid approaches that blend model output with de-vigged sharp lines further refine the assessment.
Apply a minimum edge threshold
A fixed threshold filters noise. If the calculated edge falls below 3 percent, the rating rarely justifies action after accounting for estimation error. Higher thresholds suit lower-liquidity markets where variance increases.
List of core indicators:
-
Raw implied probability derived from current odds
-
Fair probability after margin removal
-
Edge size versus independent estimate
-
Direction and magnitude of line movement
-
Closing-line value relative to the taken price
Identification of an undervalued rating rests on conversion of odds, removal of margin and quantitative comparison with independent estimates.
|
Indicator |
Calculation method |
Typical threshold for attention |
|
Raw implied probability |
1 / decimal odds |
Baseline conversion |
|
Fair probability |
Raw / market total |
Normalised comparison |
|
Edge |
True estimate – fair probability |
≥ 3–5 percentage points |
|
Line movement |
Change from open to current |
Several points in short window |
|
Expected value |
(True prob × decimal odds) – 1 |
Positive result |
Bettors who track edge size, line movement and closing-line value isolate discrepancies more reliably than those who rely on single-source prices. Market data from 2025 and 2026 show that margins continue to cluster between 2 and 7 percent according to market type. Regular application of these indicators supplies a structured basis for evaluating ratings before each decision.